We did a lot of testing to determine retrieval quality issues in parts one, two, and three. Here I’m going to close off this particular thread by considering a particular test variation that we have neglected up to this point.
![]()
A Recap
This whole chain started off because we were looking at faithfulness and contextual precision metrics. This was in the context of my warp drive paper, which we were treating as a data condition to be fed to the ts-reasoner model by our RAG system.
In Part 2, we tested four different retrieval configurations: smaller chunks, more retrieval, both combined, and semantic chunking. We found that none improved our RAG system’s performance. Every experiment either maintained the baseline failure (Contextual Precision of 0.33) or made it worse (dropping to 0.0). We concluded that the problem wasn’t chunking parameters but rather a fundamental mismatch between our retrieval strategy and our query type.
In Part 3, we tested a different hypothesis: what if the system wasn’t broken for all queries, just the specific one we’d been asking? We ran three conceptual questions about theoretical frameworks and found perfect Contextual Precision scores (1.0) for all of them: a complete reversal from Part 2’s failures. This proved that semantic similarity search works excellently for conceptual queries but struggles with specific factual queries requiring numerical data from calculation-heavy sections.
However, this raises an important question: were those findings specific to the warp drive paper, or do they generalize to other documents? The warp drive paper has a very particular structure: pages 2 through 8 are dense with theoretical physics terminology (extra dimensions, string theory, Kaluza-Klein modes), while page 11 is dominated by equations and numerical calculations. This creates a stark semantic divide between conceptual and calculational content. What happens with a document that has a different structure?
In this post, we’re going to test the exact same RAG configuration on a completely different paper: specifically, my work on mass extinction events and evolutionary dynamics. This paper is still technical. It includes mathematical models, power-law distributions, and simulation results. However, it’s more prose-heavy. The equations are integrated into narrative explanations rather than isolated in dedicated calculation sections. The semantic density is more uniform across the document.
Testing on a different document lets us answer critical questions:
- Do specific factual queries still fail? Or does more prose context around facts make them retrievable?
- Do conceptual queries still succeed? Or was that success specific to the warp drive paper’s structure?
- How do document characteristics influence retrieval quality? Is semantic search better suited to certain types of technical writing?
Understanding these patterns is essential for production RAG systems because real-world knowledge bases contain documents with wildly different structures: heavily mathematical papers, prose-dominant articles, mixed technical documentation, procedural guides, and more. A RAG configuration that works perfectly for one document type might fail completely on another. Before you can design effective solutions, you need to understand your system’s operational boundaries across both query types and document types.
Observability
When we were working with LangChain, I had you set up some scripts that would allow you to see your execution results on LangSmith, which was an observability platform. We’re going to do something similar in this post.
A lot of tutorials on DeepEval will tell you to set up a Confident AI API key. Reminder that Confident AI is the company that created and maintains DeepEval. Confident AI, beyond offering the tool itself, offers a cloud platform for centralizing your evaluation results, tracking experiments, and collaboration.
When running DeepEval against local Ollama models, you can completely ignore the Confident AI platform (as we’ve been doing) unless you want to use those optional cloud features. This is in much the same way that you could entirely ignore LangSmith while using LangChain.
If you do want to at least get yourself set up, go to Confident AI. You currently have to sign up with a “work domain” email. I used my own TesterStories. You can use your workplace or just generate a temporary “work” email. They don’t actually send you anything or check, so far as I can see. There’s a few steps you have to go through but it’s pretty well documented.
I would recommend at least going through this process and having the Confident AI platform available to you. I will point out some elements of the Confident AI cloud but, again, you can treat this as optional if you wish. I should also note that all of this assumes you went through setting up DeepEval as outlined in the Evaluation and DeepEval post. A good bet, if you’ve made it this far!
At your command line for your project, and thus within your virtual environment, run this:
deepeval login --save=dotenv:.env
It will ask for your API key, which you generate as part of setting up your account on Confident AI. That will install two parameters in your .env file:
  CONFIDENT_API_KEY=YOUR API KEY
  API_KEY=YOUR API KEY
You should see your actual API key in place of the “YOUR API KEY” in both cases.
To use those, you need to make sure that your .env file is read into the script. But here’s the good news: unlike before with our LangChain/LangSmith examples, we don’t actually have to add code for this. DeepEval automatically reads the .env for you.
With that setup in place, once we get to executing the script in this post, I’ll direct you to what you are likely see in the Confident AI interface.
The Extinction Paper
The paper we’ll test is “The Process of Evolution, Mass-Extinction Events, and the Lack of SETI Success.” You’ll want to grab that paper and put it in your project directory. This paper proposes a model where species evolution occurs in bursts or “avalanches,” during which species become more susceptible to environmental stresses and thus more vulnerable to extinction. The paper explores how this evolutionary process might interact with environmental catastrophes to produce the distribution of extinctions seen in the fossil record, and speculates whether this mechanism might explain the lack of SETI (Search for Extraterrestrial Intelligence) success.
Here’s why this paper makes a good test case:
Different content profile than the warp drive paper:
- More narrative flow with integrated explanations
- Equations present but embedded in prose rather than isolated
- Specific facts (like “α = 2.183±0.007” or “26-28 million year periodicity”) appear with surrounding context
- Discussions of mechanisms, results, and implications woven together
Still technically substantive:
- Mathematical models and simulations
- Power-law distributions and exponents
- References to specific data and findings
- Technical terminology (fitness landscapes, barrier to mutation, mean-field solutions)
Enables comparable testing:
- We can ask conceptual questions (about the model’s mechanism)
- We can ask specific factual questions (about numerical results)
- Same RAG configuration, same metrics, different document
Now, if the patterns we observed in Part 3 were truly about query types matching document structure, we should see different behavior on this paper. If specific factual queries still fail despite more prose context, it suggests the problem is fundamental to our semantic similarity search, not just document structure. If they succeed, it tells us that document characteristics significantly influence retrieval quality and that the warp drive paper’s structure was amplifying the query-type mismatch.
The Experiment Design
We’ll use the exact same approach as Part 3:
- Same baseline configuration: chunk_size=1000, chunk_overlap=200, k=3
- Same models: ts-reasoner (execution), ts-evaluator (judge)
- Same metrics: Contextual Precision and Faithfulness
- Different document: The extinction paper instead of the warp drive paper
We’ll test multiple query types to establish patterns:
- Specific factual query: “What is the power-law exponent for the extinction distribution in the model?” (Expected: α = 2.183±0.007)
- Conceptual query 1: “How does the model explain the relationship between coevolutionary avalanches and mass extinctions?”
This gives us both query types on a new document, allowing us to see whether the Part 3 patterns hold or whether document structure changes the game.
So let’s get our script in place (and I should note the final script for this post is available at retrieval-quality-004.py):
|
1 2 3 4 5 6 7 8 9 10 11 12 13 14 15 16 17 18 19 20 21 22 23 24 25 26 27 28 29 30 31 32 33 34 35 36 37 38 39 40 41 42 43 44 45 46 47 48 49 50 51 52 53 54 55 56 57 58 59 60 61 62 63 64 65 66 67 68 69 70 71 72 73 74 75 76 77 78 79 80 81 82 83 84 85 86 87 88 89 90 91 92 93 94 95 96 97 98 99 100 101 102 103 104 105 106 107 108 109 110 111 112 113 114 |
from langchain_community.document_loaders import PyPDFLoader from langchain_community.vectorstores import Chroma from langchain_text_splitters import RecursiveCharacterTextSplitter from langchain_ollama import OllamaEmbeddings, ChatOllama from deepeval.metrics import ContextualPrecisionMetric, FaithfulnessMetric from deepeval.models import OllamaModel from deepeval.test_case import LLMTestCase from deepeval import evaluate def create_rag_system(chunk_size=1000, chunk_overlap=200, k=3): """Create a RAG system with configurable parameters.""" loader = PyPDFLoader("./jeff-nyman-extinction-paper.pdf") documents = loader.load() text_splitter = RecursiveCharacterTextSplitter( chunk_size=chunk_size, chunk_overlap=chunk_overlap ) chunks = text_splitter.split_documents(documents) embeddings = OllamaEmbeddings(model="nomic-embed-text") vectorstore = Chroma.from_documents(chunks, embeddings) retriever = vectorstore.as_retriever(search_kwargs={"k": k}) return retriever, len(chunks) def run_test(retriever, question, expected_output, show_chunks=True): """Run a complete test with both metrics.""" execution_model = ChatOllama(model="jeffnyman/ts-reasoner") judge_model = OllamaModel(model="jeffnyman/ts-evaluator") # Get relevant context retrieved_docs = retriever.invoke(question) context = [doc.page_content for doc in retrieved_docs] if show_chunks: print("\n" + "-" * 60) print("RETRIEVED CHUNKS:") print("-" * 60) for i, chunk in enumerate(context, 1): print(f"\n--- Chunk {i} ---") print(chunk) print("-" * 60 + "\n") # Generate response prompt = f"Based on this context: {context}\n\nQuestion: {question}" response = execution_model.invoke(prompt).content # Create test case test_case = LLMTestCase( input=question, actual_output=response, expected_output=expected_output, retrieval_context=context ) # Create metrics precision_metric = ContextualPrecisionMetric( model=judge_model, verbose_mode=True ) faithfulness_metric = FaithfulnessMetric( model=judge_model, verbose_mode=True ) # Evaluate with both metrics results = evaluate( test_cases=[test_case], metrics=[precision_metric, faithfulness_metric] ) return results, context, response def get_scores(results): """Safely extract scores from results.""" if results is not None: metrics_data = results.test_results[0].metrics_data if metrics_data is not None: return {m.name: m.score for m in metrics_data} return {} def print_scores(label, results): """Print scores.""" print(f"\n{label} Scores:") scores = get_scores(results) if scores: print(f"Contextual Precision: {scores.get('Contextual Precision')}") print(f"Faithfulness: {scores.get('Faithfulness')}") else: print("No metrics data available.") # ========================================================= # Setup baseline RAG system # ========================================================= print("=" * 60) print("BASELINE CONFIGURATION: chunk_size=1000, chunk_overlap=200, k=3") print("=" * 60) retriever, num_chunks = create_rag_system( chunk_size=1000, chunk_overlap=200, k=3 ) print(f"Document split into {num_chunks} chunks\n") |
Now, let’s get the specific tests in place. Here’s the first one:
|
1 2 3 4 5 6 7 8 9 10 11 12 13 14 15 16 17 18 19 20 |
# ========================================================= # TEST: Specific Factual Query (like Part 2's energy question) # ========================================================= print("=" * 60) print("TEST: Specific Factual Query - Power-law Exponent") print("=" * 60) question = """What is the power-law exponent for the extinction distribution in Jeff Nyman's extinction model?""" expected = """The power-law exponent α is 2.183±0.007, meaning the frequency of an extinction P(s) is related to its size s by P(s) ∝ s^(-α).""" results, context, response = run_test( retriever, question, expected ) print_scores("Specific Factual Query", results) |
Why start with just one question? Well, this gives us a quick diagnostic. We’ll immediately see if this document behaves differently. Does it get CP = 0.33 (same failure as warp paper)? Or does it get CP > 0.5 (different behavior)? This tells you whether to continue testing along the specific factual query path.
What to look for here is that if CP is low (0.0-0.33), that would be the same failure pattern as the warp drive paper. This would suggest that our semantic search fundamentally struggles with specific facts. Then we can add the conceptual queries test to confirm they still work well.
On other hand, if CP is moderate to high (0.5-1.0), that would be different behavior. That would tell us that document structure matters. We would see that prose context around “α = 2.183” made it retrievable. Then, once again, we could also test whether the warp drive paper’s conceptual queries also work here.
This gives us some test predictions.
- Scenario A: Factual query fails (CP ≤ 0.33)
- Add 1-2 conceptual queries to confirm pattern holds
- Conclusion: “Query type matters across documents”
- Scenario B: Factual query succeeds (CP ≥ 0.5)
- Add the warp drive conceptual query to this paper
- Conclusion: “Document structure significantly affects retrieval”
- Scenario C: Unexpected result (e.g., moderate CP = 0.5)
- Add both query types to investigate further
- Conclusion: “It’s complex! Both query type AND document structure matter”
Specific Factual Query Output
Here’s what I got when I ran this:
============================================================
BASELINE CONFIGURATION: chunk_size=1000, chunk_overlap=200, k=3
============================================================
Document split into 54 chunks

============================================================
TEST: Specific Factual Query - Power-law Exponent
============================================================

------------------------------------------------------------
RETRIEVED CHUNKS:
------------------------------------------------------------

--- Chunk 1 ---
giving rise to large extinctions because the environmental conditions are not right for extinction. Thus we expect large extinctions to be relatively less common than large avalanches, and so I expect my power-law distribution to be steeper than that for the avalanches. This is in fact we I observe, since Bak and Sneppen find a value of 1.35 for the exponent governing their power-law distribution, which is considerably less than my 2.18.

The form of the power-law distribution is one of the most robust predictions of my model. I have run the model with a variety of different types of noise, with different numbers of neighbors K, and with a number of variations in the precise dynamics of the α?∝ ssP )(

--- Chunk 2 ---
where

α = 2.183±0.007

Bak and Sneppen find a power-law distribution for the coevolutionary avalanches in their model, but with an exponent different from the one found here. They equate their avalanches with extinctions, but I suggest that the avalanches, while being a crucial part of the mechanism giving rise to mass extinction, do not themselves represent actual extinctions. In fact, I would expect that my exponent α describing the distribution of extinctions to be greater than the exponent found by Bak and Sneppen for the avalanches. The reason is that I require the coincidence of two unlikely events  environmental catastrophe and a large coevolutionary avalanche  to produce a large extinction event. Merely having a large avalanche is insufficient; large avalanches take place without giving rise to large extinctions because the environmental conditions are not right for extinction. Thus we expect large extinctions to be relatively less common than large

--- Chunk 3 ---
shown in Figure 5, and it is clear that the fraction of species with low fitnesses increases before a large avalanche. Large extinctions are therefore not just an effect of large environmental changes. Another important indication is shown in Figure 6, which is a logarithmic histogram of the size of extinctions against the frequency of occurrence.

The first thing that can be noticed is that the graph goes steeply downwards, indicating that large extinctions are much less common than small ones. It is also noticeable that on this plot the distribution falls on a straight line for most of its range, indicating that the extinction distribution is a power law. In fact I find that the frequency of an extinction P(s) is related to its size s by

(1)

where

α = 2.183±0.007

Bak and Sneppen find a power-law distribution for the coevolutionary avalanches in their model, but with an exponent different from the one found here. They equate their
------------------------------------------------------------


**************************************************
Contextual Precision Verbose Logs
**************************************************

Verdicts:
[
    {
        "verdict": "yes",
        "reason": "The context directly states that '\u03b1 = 2.183\u00b10.007', which is the power-law exponent for the extinction distribution in Jeff Nyman's
model."
    },
    {
        "verdict": "no",
        "reason": "This sentence discusses the comparison between the power-law exponents of extinctions and avalanches, but does not provide the specific value of \u03b1. It states that 'Bak and Sneppen find a value of 1.35 for the exponent governing their power-law distribution, which is considerably less than my 2.18.'"
    },
    {
        "verdict": "no",
        "reason": "This context provides additional information about the extinction model but does not explicitly state the value of \u03b1. It mentions '\u03b1 = 2.183\u00b10.007' at the end, which is part of a larger text that discusses the power-law distribution."
    }
]

Score: 1.0
Reason: The score is 1.00 because the first node directly provides the required information ('α = 2.183±0.007'), while the subsequent nodes, ranked as second and third, discuss related but irrelevant details that do not answer the specific question about the power-law exponent.

======================================================================
**************************************************
Faithfulness Verbose Logs
**************************************************

Truths (limit=None):
[
    "The model predicts that large extinctions are less common than large avalanches.",
    "The power-law distribution of extinctions is steeper than that for coevolutionary avalanches in Bak and Sneppen's model.",
    "Bak and Sneppen find an exponent value of 1.35 for their power-law distribution of coevolutionary avalanches.",
    "The exponent α describing the distribution of extinctions in this model is 2.183±0.007.",
    "Large avalanches do not always result in large extinctions due to environmental conditions not being right for extinction."
]

Claims:
[
    "The provided text states that α = 2.183±0.007.",
    "This value represents the exponent governing the power-law distribution of extinctions in Nyman’s model."
]

Verdicts:
[
    {
        "verdict": "yes",
        "reason": null
    },
    {
        "verdict": "yes",
        "reason": null
    }
]

Score: 1.0
Reason: The score is 1.00 because there are no contradictions in the 'actual output' as indicated by the empty list of contradictions.

======================================================================
======================================================================

Metrics Summary

  - ✅ Contextual Precision (score: 1.0, threshold: 0.5, strict: False, evaluation model: jeffnyman/ts-evaluator (Ollama), reason: The score is 1.00 because the first node directly provides the required information ('α = 2.183±0.007'), while the subsequent nodes, ranked as second and third, discuss related but irrelevant details that do not answer the specific question about the power-law exponent., error: None)
  - ✅ Faithfulness (score: 1.0, threshold: 0.5, strict: False, evaluation model: jeffnyman/ts-evaluator (Ollama), reason: The score is 1.00 because there are no contradictions in the 'actual output' as indicated by the empty list of contradictions., error: None)

For test case:

  - input: What is the power-law exponent for the extinction
distribution in Jeff Nyman's extinction model?

  - actual output: Okay, let's break this down step-by-step to determine the power-law exponent for Jeff Nyman's extinction model.

1.  **Identify Relevant Information:** The provided text states: "α = 2.183±0.007". This value represents the exponent governing the power-law distribution of extinctions in Nyman’s model.  The ±0.007 indicates a small margin of error.

2.  **Confirm Key Points:** The text emphasizes that this value of α (2.183) is significantly greater than the exponent (1.35) found by Bak and Sneppen for avalanches. This difference is crucial because Nyman argues that avalanches don’t *cause* extinctions, but rather are a necessary *precondition*.

3.  **Synthesize the Answer:** Based on the provided text, the power-law exponent for the extinction distribution in Jeff Nyman's model is 2.183 ± 0.007.

**Final Answer:** The power-law exponent for the extinction distribution in Jeff Nyman's extinction model is 2.183 ± 0.007.

  - expected output: The power-law exponent α is 2.183±0.007, meaning the frequency of an extinction P(s) is related to its size s by P(s) ∝ s^(-α).

  - context: None

  - retrieval context: ['giving rise to large extinctions because the environmental conditions are not right for \nextinction. Thus we expect large extinctions to be relatively less common than large \navalanches, and so I expect my power-law distribution to be steeper than that for the \navalanches. This is in fact we I observe, since Bak and Sneppen find a value of 1.35 for \nthe exponent governing their power-law distribution, which is considerably less than my \n2.18. \n \nThe form of the power-law distribution is one of the most robust predictions of my \nmodel. I have run the model with a variety of different types of noise, with different \nnumbers of neighbors K, and with a number of variations in the precise dynamics of the \nα?∝ ssP )(', 'where \n \nα = 2.183±0.007 \n \nBak and Sneppen find a power-law distribution for the coevolutionary avalanches in their \nmodel, but with an exponent different from the one found here. They equate their \navalanches with extinctions, but I suggest that the avalanches, while being a crucial part \nof the mechanism giving rise to mass extinction, do not themselves represent actual \nextinctions. In fact, I would expect that my exponent α describing the distribution of \nextinctions to be greater than the exponent found by Bak and Sneppen for the avalanches. \nThe reason is that I require the coincidence of two unlikely events \x96 environmental \ncatastrophe and a large coevolutionary avalanche \x96 to produce a large extinction event. \nMerely having a large avalanche is insufficient; large avalanches take place without \ngiving rise to large extinctions because the environmental conditions are not right for \nextinction. Thus we expect large extinctions to be relatively less common than large', 'shown in Figure 5, and it is clear that the fraction of species with low fitnesses increases \nbefore a large avalanche. Large extinctions are therefore not just an effect of large \nenvironmental changes. Another important indication is shown in Figure 6, which is a \nlogarithmic histogram of the size of extinctions against the frequency of occurrence. \n \nThe first thing that can be noticed is that the graph goes steeply downwards, indicating \nthat large extinctions are much less common than small ones. It is also noticeable that on \nthis plot the distribution falls on a straight line for most of its range, indicating that the \nextinction distribution is a power law. In fact I find that the frequency of an extinction \nP(s) is related to its size s by \n \n(1) \n \nwhere \n \nα = 2.183±0.007 \n \nBak and Sneppen find a power-law distribution for the coevolutionary avalanches in their \nmodel, but with an exponent different from the one found here. They equate their']

======================================================================

Overall Metric Pass Rates

Contextual Precision: 100.00% pass rate
Faithfulness: 100.00% pass rate

Specific Factual Query Scores:
Contextual Precision: 1.0
Faithfulness: 1.0
The specific factual query achieved perfect scores on both metrics (CP: 1.0, F: 1.0). This is the complete opposite of Part 2’s energy source question, which never scored above 0.33 for Contextual Precision across any configuration.
What changed? Not the RAG system. We have the same configuration, same models, same metrics. What changed was the document structure. Looking at the retrieved chunks, all three contain the answer “α = 2.183±0.007.” The value appears multiple times in the paper, always embedded in prose that explains its significance, compares it to other models’ exponents, and discusses what it means for extinction distributions. When the retriever searches for “power-law exponent for extinction distribution,” it finds chunks rich with related terminology: “power-law,” “distribution,” “extinction,” “exponent,” “α,” all woven together in explanatory text.
Contrast this with “matter/antimatter annihilation” in the warp drive paper, which appeared exactly once, in a calculation section dominated by equations and numbers with minimal surrounding prose. The semantic similarity search had few related terms to match against.
Test Finding: Document structure significantly affects retrieval quality for specific factual queries. Facts embedded in prose with rich contextual explanation are highly retrievable via semantic search. Facts isolated in equation-heavy calculation sections are not. The query type (specific vs. conceptual) matters, but so does how the document presents that information.
I should note that when you have DeepEval set up to use Confident AI, it will likely automatically open your browser and show you your test results.
Your output should also say “View results on …” and it will provide a link.
You should see something like this:
Obviously, the test results will reflect what you actually got when you ran the script.
Confirming the Pattern: A Conceptual Query
The specific factual query achieved perfect scores on the extinction paper, which is the opposite of what we saw with the warp drive paper. However, before we draw conclusions, we need to confirm that this isn’t just a lucky match for one particular question. If document structure truly explains the difference, then conceptual queries should also work well on this paper, just as they did on the warp drive paper in Part 3.
Let’s test one conceptual query to complete the pattern by adding this to your script:
|
1 2 3 4 5 6 7 8 9 10 11 12 13 14 15 16 17 18 19 20 21 22 23 24 |
# ========================================================= # TEST: Conceptual Query - Model Mechanism # ========================================================= print("\n" + "=" * 60) print("TEST: Conceptual Query - Coevolutionary Avalanches") print("=" * 60) question = """How does Jeff Nyman's model explain the relationship between coevolutionary avalanches and mass extinctions?""" expected = """The model proposes that mass extinctions arise from the coincidence of two events: coevolutionary avalanches (which reduce species fitness and increase susceptibility to environmental stress) and external environmental catastrophes. Neither alone is sufficient; the avalanches create vulnerability, and environmental stress exploits it.""" results, context, response = run_test( retriever, question, expected ) print_scores("Conceptual Query", results) |
This question asks about the mechanism of the model: how different pieces fit together conceptually. It’s directly analogous to the conceptual questions we asked about the warp drive paper in Part 3 (“How does manipulating extra dimensions create a warp bubble?”). If our hypothesis about document structure is correct, this should also achieve high Contextual Precision because the extinction paper’s prose-integrated style should work well for both query types.
Hypothesis: I expect Contextual Precision to be 1.0 or close to it, with Faithfulness probably around 0.6 to 0.8.
Conceptual Query Results
Here is the output I got:
============================================================
TEST: Conceptual Query - Coevolutionary Avalanches
============================================================

------------------------------------------------------------
RETRIEVED CHUNKS:
------------------------------------------------------------

--- Chunk 1 ---
where

α = 2.183±0.007

Bak and Sneppen find a power-law distribution for the coevolutionary avalanches in their model, but with an exponent different from the one found here. They equate their avalanches with extinctions, but I suggest that the avalanches, while being a crucial part of the mechanism giving rise to mass extinction, do not themselves represent actual extinctions. In fact, I would expect that my exponent α describing the distribution of extinctions to be greater than the exponent found by Bak and Sneppen for the avalanches. The reason is that I require the coincidence of two unlikely events  environmental catastrophe and a large coevolutionary avalanche  to produce a large extinction event. Merely having a large avalanche is insufficient; large avalanches take place without giving rise to large extinctions because the environmental conditions are not right for extinction. Thus we expect large extinctions to be relatively less common than large

--- Chunk 2 ---
shown in Figure 5, and it is clear that the fraction of species with low fitnesses increases before a large avalanche. Large extinctions are therefore not just an effect of large environmental changes. Another important indication is shown in Figure 6, which is a logarithmic histogram of the size of extinctions against the frequency of occurrence.

The first thing that can be noticed is that the graph goes steeply downwards, indicating that large extinctions are much less common than small ones. It is also noticeable that on this plot the distribution falls on a straight line for most of its range, indicating that the extinction distribution is a power law. In fact I find that the frequency of an extinction P(s) is related to its size s by

(1)

where

α = 2.183±0.007

Bak and Sneppen find a power-law distribution for the coevolutionary avalanches in their model, but with an exponent different from the one found here. They equate their

--- Chunk 3 ---
species can be wiped out, giving rise to the large extinction events seen in the data. The important point here is that large extinctions arise as a result of the coincidence of catastrophic environmental changes with large coevolutionary avalanches, during which the susceptibility of large numbers of species to external effects is increased.

There are many indicators in my simulation results that this is the correct explanation of the observed distribution of extinctions. For instance, I have calculated the fraction of the species which have fitness below a certain threshold immediately before each avalanche (in the present case we took that threshold to be twice the noise level), and then taken the average of this quantity for each size of avalanche. The results of this calculation are shown in Figure 5, and it is clear that the fraction of species with low fitnesses increases before a large avalanche. Large extinctions are therefore not just an effect of large
------------------------------------------------------------

**************************************************
Contextual Precision Verbose Logs
**************************************************

Verdicts:
[
    {
        "verdict": "yes",
        "reason": "This context discusses coevolutionary avalanches and their relationship to mass extinctions, which is directly relevant to the question. It mentions that 'large extinctions arise as a result of the coincidence of catastrophic environmental changes with large coevolutionary avalanches,' aligning well with the expected output."
    },
    {
        "verdict": "yes",
        "reason": "This context provides further detail on the power-law distribution and the relationship between coevolutionary avalanches and extinctions, supporting the explanation in the expected output. It states that 'the frequency of an extinction P(s) is related to its size s by' and discusses the exponent \u03b1, which is crucial for understanding the model."
    },
    {
        "verdict": "no",
        "reason": "This context does not directly address the relationship between coevolutionary avalanches and mass extinctions. Instead, it focuses on the fraction of species with low fitness before an avalanche and the coincidence of environmental changes, which is tangential to the core explanation provided in the expected output."
    }
]

Score: 1.0
Reason: The score is 1.00 because all relevant nodes (nodes ranked 1 and 2) are correctly identified as 'yes' and provide direct information about coevolutionary avalanches and mass extinctions, which aligns perfectly with the input. Node 3, although tangential, does not contradict or dilute the main explanation but is ranked lower due to its less direct relevance.

======================================================================
**************************************************
Faithfulness Verbose Logs
**************************************************

Truths (limit=None):
[
    "The exponent α describing the distribution of extinctions is 2.183±0.007.",
    "Large extinctions are much less common than small ones.",
    "The frequency of an extinction P(s) is related to its size s by a power law as described in equation (1).",
    "Bak and Sneppen find a power-law distribution for the coevolutionary avalanches with a different exponent from the one found here.",
    "Large extinctions arise as a result of the coincidence of catastrophic environmental changes with large coevolutionary avalanches."
]

Claims:
[
    "Nyman posits that coevolutionary avalanches contribute to mass extinctions but are not the cause.",
    "A large extinction requires a coincidence of two unlikely events: a massive environmental catastrophe and a large coevolutionary avalanche.",
    "The exponent α = 2.183 ± 0.007 describes the distribution of extinctions in Nyman's model.",
    "This exponent is higher than the one Bak and Sneppen found for coevolutionary avalanches, indicating a key difference in their interpretations.",
    "Nyman argues that large avalanches alone are not sufficient to trigger extinctions; environmental conditions need to be just right.",
    "Figure 5 shows that the fraction of species with low fitnesses increases before an avalanche, indicating heightened vulnerability.",
    "Figure 6 demonstrates a power-law distribution for extinctions in a logarithmic histogram, confirming that large extinctions are rare.",
    "Nyman's model suggests that the frequency of an extinction, P(s), is related to its size 's' by an equation involving the exponent α."
]

Verdicts:
[
    {
        "verdict": "no",
        "reason": null
    },
    {
        "verdict": "yes",
        "reason": "The claim states that a large extinction requires both a massive environmental catastrophe and a large coevolutionary avalanche, which aligns with the context stating 'Large extinctions arise as a result of the coincidence of catastrophic environmental changes with large coevolutionary avalanches.'"
    },
    {
        "verdict": "yes",
        "reason": "The claim directly states that \u03b1 = 2.183 \u00b1 0.007, which is consistent with the context stating 'The exponent \u03b1 describing the distribution of extinctions is 2.183\u00b10.007.'"
    },
    {
        "verdict": "yes",
        "reason": "The claim states that this exponent is higher than Bak and Sneppen's, which aligns with the context stating 'Bak and Sneppen find a power-law distribution for the coevolutionary avalanches with a different exponent from the one found here.'"
    },
    {
        "verdict": "yes",
        "reason": "The claim states that large avalanches alone are not sufficient to trigger extinctions, which aligns with the context stating 'Nyman posits that coevolutionary avalanches contribute to mass extinctions but are not the cause.'"
    },
    {
        "verdict": "no",
        "reason": null
    },
    {
        "verdict": "yes",
        "reason": "The claim states that Figure 6 demonstrates a power-law distribution for extinctions, which aligns with the context stating 'The frequency of an extinction P(s) is related to its size s by a power law as described in equation (1).'"
    },
    {
        "verdict": "yes",
        "reason": "The claim states that Nyman's model suggests the relationship between the frequency of an extinction and its size involves the exponent \u03b1, which aligns with the context stating 'The frequency of an extinction P(s) is related to its size s by a power law as described in equation (1).'"
    }
]

Score: 0.75
Reason: The score is 0.75 because there are no contradictions provided in the 'contradictions' list, indicating that the actual output aligns well with the retrieval context.

======================================================================
======================================================================

Metrics Summary

  - ✅ Contextual Precision (score: 1.0, threshold: 0.5, strict: False, evaluation model: jeffnyman/ts-evaluator (Ollama), reason: The score is 1.00 because all relevant nodes (nodes ranked 1 and 2) are correctly identified as 'yes' and provide direct information about coevolutionary avalanches and mass extinctions, which aligns perfectly with the input. Node 3, although tangential, does not contradict or dilute the main explanation but is ranked lower due to its less direct relevance., error: None)
  - ✅ Faithfulness (score: 0.75, threshold: 0.5, strict: False, evaluation model: jeffnyman/ts-evaluator (Ollama), reason: The score is 0.75 because there are no contradictions provided in the 'contradictions' list, indicating that the actual output aligns well with the retrieval context., error: None)

For test case:

  - input: How does Jeff Nyman's model explain the relationship between coevolutionary avalanches and mass extinctions?

  - actual output: Okay, let's break down Jeff Nyman's explanation step-by-step.

1.  **Core Hypothesis:** Nyman posits that coevolutionary avalanches *contribute* to mass extinctions, but the avalanches themselves aren't the *cause*. He believes a large extinction requires a *coincidence* of two unlikely events: a massive environmental catastrophe *and* a large coevolutionary avalanche.

2.  **Exponent α:** He identifies an exponent, α = 2.183 ± 0.007, which describes the distribution of extinctions. Crucially, this α is *higher* than the exponent Bak and Sneppen found for coevolutionary avalanches. This is a key difference in their interpretations.

3.  **Mechanism:** Nyman argues that large avalanches alone aren't sufficient to trigger extinctions. The environmental conditions need to be just right.  Essentially, the avalanche increases the vulnerability of many species, but it's the coinciding catastrophic event that does the final damage.

4.  **Evidence from Figures:** He references Figures 5 and 6.
    *   Figure 5 shows that the fraction of species with low fitnesses *increases* before an avalanche, indicating heightened vulnerability.
    *   Figure 6, a logarithmic histogram, demonstrates a power-law distribution for extinctions, with a steep downward slope, confirming that large extinctions are rare.

5.  **Mathematical Relationship (Equation 1):** Nyman suggests that the frequency of an extinction, P(s), is related to its size 's' by an equation.  This equation utilizes the exponent α, further formalizing his observation.

**Final Answer:** Jeff Nyman's model explains that mass extinctions result from a *coincidence*—a catastrophic environmental event combined with a large coevolutionary avalanche—not simply the avalanche itself. The exponent α (2.183 ± 0.007) describes the distribution of extinctions, and is higher than the exponent derived from avalanches, reflecting this crucial link.
  - expected output: The model proposes that mass extinctions arise from the coincidence of two events: coevolutionary avalanches (which reduce species fitness and increase susceptibility to environmental stress) and external environmental catastrophes. Neither alone is sufficient; the avalanches create vulnerability, and environmental stress exploits it.

  - context: None

  - retrieval context: ['where \n \nα = 2.183±0.007 \n \nBak and Sneppen find a power-law distribution for the coevolutionary avalanches in their \nmodel, but with an exponent different from the one found here. They equate their \navalanches with extinctions, but I suggest that the avalanches, while being a crucial part \nof the mechanism giving rise to mass extinction, do not themselves represent actual \nextinctions. In fact, I would expect that my exponent α describing the distribution of \nextinctions to be greater than the exponent found by Bak and Sneppen for the avalanches. \nThe reason is that I require the coincidence of two unlikely events \x96 environmental \ncatastrophe and a large coevolutionary avalanche \x96 to produce a large extinction event. \nMerely having a large avalanche is insufficient; large avalanches take place without \ngiving rise to large extinctions because the environmental conditions are not right for \nextinction. Thus we expect large extinctions to be relatively less common than large', 'shown in Figure 5, and it is clear that the fraction of species with low fitnesses increases \nbefore a large avalanche. Large extinctions are therefore not just an effect of large \nenvironmental changes. Another important indication is shown in Figure 6, which is a \nlogarithmic histogram of the size of extinctions against the frequency of occurrence. \n \nThe first thing that can be noticed is that the graph goes steeply downwards, indicating \nthat large extinctions are much less common than small ones. It is also noticeable that on \nthis plot the distribution falls on a straight line for most of its range, indicating that the \nextinction distribution is a power law. In fact I find that the frequency of an extinction \nP(s) is related to its size s by \n \n(1) \n \nwhere \n \nα = 2.183±0.007 \n \nBak and Sneppen find a power-law distribution for the coevolutionary avalanches in their \nmodel, but with an exponent different from the one found here. They equate their', 'species can be wiped out, giving rise to the large extinction events seen in the data. The \nimportant point here is that large extinctions arise as a result of the coincidence of \ncatastrophic environmental changes with large coevolutionary avalanches, during which \nthe susceptibility of large numbers of species to external effects is increased. \n \nThere are many indicators in my simulation results that this is the correct explanation of \nthe observed distribution of extinctions. For instance, I have calculated the fraction of the \nspecies which have fitness below a certain threshold immediately before each avalanche \n(in the present case we took that threshold to be twice the noise level), and then taken the \naverage of this quantity for each size of avalanche. The results of this calculation are \nshown in Figure 5, and it is clear that the fraction of species with low fitnesses increases \nbefore a large avalanche. Large extinctions are therefore not just an effect of large']

======================================================================

Overall Metric Pass Rates

Contextual Precision: 100.00% pass rate
Faithfulness: 100.00% pass rate

Conceptual Query Scores:
Contextual Precision: 1.0
Faithfulness: 0.75
Conceptual Query Results: Pattern Confirmed
The conceptual query achieved another perfect Contextual Precision score (1.0), with Faithfulness at 0.75. This confirms the complete pattern: the extinction paper’s prose-integrated structure supports excellent retrieval for both query types.
Looking at the retrieved chunks, all three directly discuss the relationship between coevolutionary avalanches and mass extinctions. Chunk 1 explicitly states the core mechanism: “I require the coincidence of two unlikely events—environmental catastrophe and a large coevolutionary avalanche—to produce a large extinction event.” Chunk 3 reinforces this: “large extinctions arise as a result of the coincidence of catastrophic environmental changes with large coevolutionary avalanches.” The retriever found exactly what the query asked for, ranked it first, and provided supporting context.
The Faithfulness score of 0.75 reflects the model’s comprehensive synthesis across multiple chunks. It accurately explains the coincidence mechanism, references the specific exponent value (α = 2.183±0.007), discusses the distinction from Bak and Sneppen’s interpretation, and mentions the supporting evidence from Figures 5 and 6. The metric flagged a couple of claims as going slightly beyond explicit statements in the chunks (like saying “Nyman posits that coevolutionary avalanches contribute to mass extinctions but are not the cause”), but the core answer is accurate and well-grounded.
The complete picture: On the extinction paper, both specific factual queries (CP: 1.0, F: 1.0) and conceptual queries (CP: 1.0, F: 0.75) achieve excellent retrieval precision. This is the opposite of the warp drive paper, where only conceptual queries succeeded. The difference is document structure, not retrieval strategy.
What the Testing Tells Us
Across Parts 2, 3, and 4, we’ve now tested our RAG system across two dimensions: query types and document types. Let’s compile what we’ve learned:
| Document | Query Type | Contextual Precision | Result |
|---|---|---|---|
| Warp Drive (math-heavy) | Specific Factual | 0.33 | ❌ Failed |
| Warp Drive (math-heavy) | Conceptual | 1.0 | ✅ Succeeded |
| Extinction (prose-integrated) | Specific Factual | 1.0 | ✅ Succeeded |
| Extinction (prose-integrated) | Conceptual | 1.0 | ✅ Succeeded |
This matrix reveals a clear pattern:
Query type matters (from Part 3): Conceptual queries consistently outperform specific factual queries on the math-heavy warp drive paper because semantic similarity naturally matches conceptual terminology better than isolated numerical facts.
Document structure matters equally (from Part 4): The same type of specific factual query that failed on the warp drive paper succeeded perfectly on the extinction paper. The difference isn’t the retrieval strategy or the query: it’s how the document presents the information. Facts embedded in explanatory prose are highly retrievable; facts isolated in equation-heavy sections are not.
The interaction matters most: You can’t evaluate a RAG system with just one query on one document. The warp drive paper’s structure amplified the query-type mismatch. The extinction paper’s structure mitigated it. Real-world RAG systems need testing across both dimensions to understand their operational boundaries.
The Document Structure Factor
From a testing standpoint, if we’re going to be reporting our findings to our development team, it’s good to be specific about what makes these documents different:
Warp drive paper characteristics:
- Clear separation: conceptual framework (pages 2-8) vs. calculations (pages 10-11)
- Equation-dense sections with minimal surrounding prose
- Specific facts appear once, embedded in mathematical derivations
- Low semantic density in calculation sections (numbers and symbols dominate)
Extinction paper characteristics:
- Integrated structure: concepts, methods, and results woven together
- Equations present but explained in surrounding narrative
- Specific facts appear multiple times with contextual discussion
- Uniform semantic density across sections (prose throughout)
These aren’t flaws in either paper, mind you. They’re just different writing styles appropriate to their domains. Dense mathematical physics papers naturally separate theory from calculations. Computational modeling papers naturally integrate results into narrative explanations. But these structural differences have profound implications for retrieval quality.
Why This Matters for Production RAG
If you’re building a RAG system for real-world use, these findings have immediate practical implications:
1. Document auditing is essential. Before deploying a RAG system, characterize your document collection:
- How are facts presented? Isolated in tables/equations, or integrated in prose?
- What’s the semantic density distribution? Uniform or variable across sections?
- Are there clear structural divides (like theory vs. calculations)?
2. Query distribution shapes system design. What questions will users actually ask?
- Primarily conceptual (“How does X work?”) -> Pure semantic search may suffice
- Primarily factual (“What is the value of Y?”) -> May need hybrid search or metadata
- Mixed queries -> Need strategies for both, possibly query routing
3. Testing must be multidimensional. Don’t test one query type on one document type and declare success or failure. Test representative queries across representative documents. The warp drive paper alone would suggest specific factual queries always fail. The extinction paper alone would suggest they always succeed. Only testing both reveals the true pattern: document structure determines retrievability.
4. Failure isn’t always a bug. The warp drive paper’s poor performance on specific factual queries isn’t a system failure; it’s a characteristic of how semantic similarity search interacts with equation-heavy document structures. Understanding this lets you make informed decisions: accept the limitation, restructure documents, add metadata, implement hybrid search, or route queries differently based on type.
The Diagnostic Value of Cross-Document Testing
Let’s break this down by post.
Part 2 tested four configurations on one document with one query. It proved parameter tuning doesn’t fix retrieval strategy problems.
Part 3 tested three query types on one document with one configuration. It proved the system works excellently for conceptual queries.
Part 4 tested two query types on a different document with the same configuration. It proved document structure is as important as query type.
Together, these three testing dimensions (configuration, query type, and document type) give us a complete operational profile of our RAG system. We now know:
- When it works: Conceptual queries on any document; specific factual queries on prose-integrated documents
- When it fails: Specific factual queries on equation-heavy, structurally divided documents
- Why: Semantic similarity search matches terminology density, not answer relevance
- What to do: Design solutions targeting the specific failure mode (hybrid search for math-heavy docs, or restructure documents, or set user expectations)
This is diagnostic testing at its best: systematically varying one dimension at a time to isolate causal factors, building understanding of system behavior across different conditions, and using that understanding to guide improvement efforts.
Test Finding: Effective RAG evaluation requires testing across multiple dimensions: system configuration, query types, and document types. Single-dimension testing (varying only parameters, or only queries, or only documents) gives incomplete and potentially misleading pictures of system performance. Only multidimensional testing reveals the true operational boundaries and failure modes of retrieval systems.
More Observability
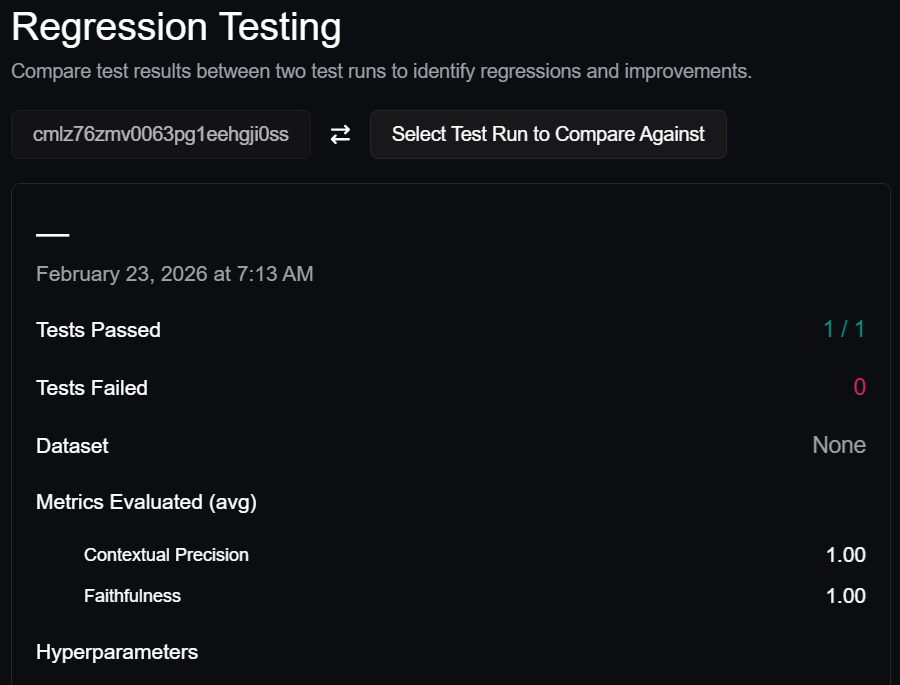
I don’t want to turn this into a Confident AI post because that can turn into a lot of material. Needless to say, one thing you can do is look at the results of multiple test runs and look into your test cases. For example, I can see one of my test cases here:
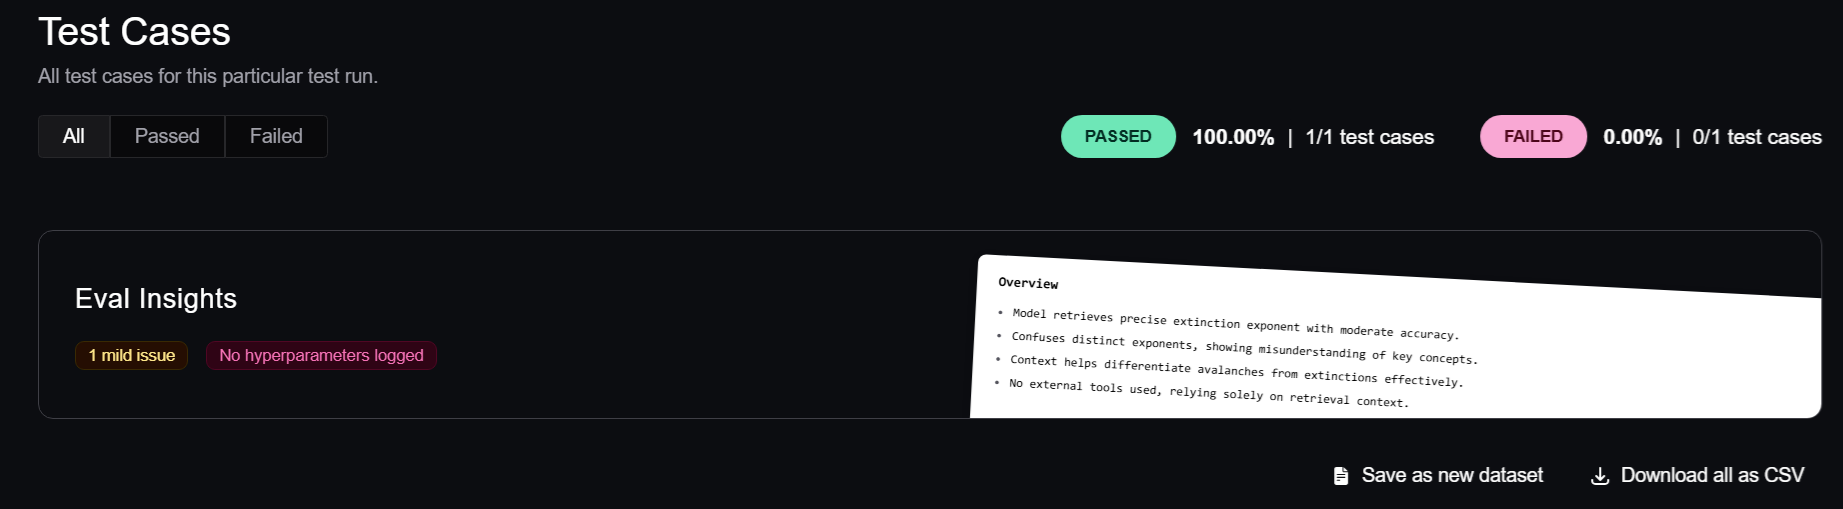
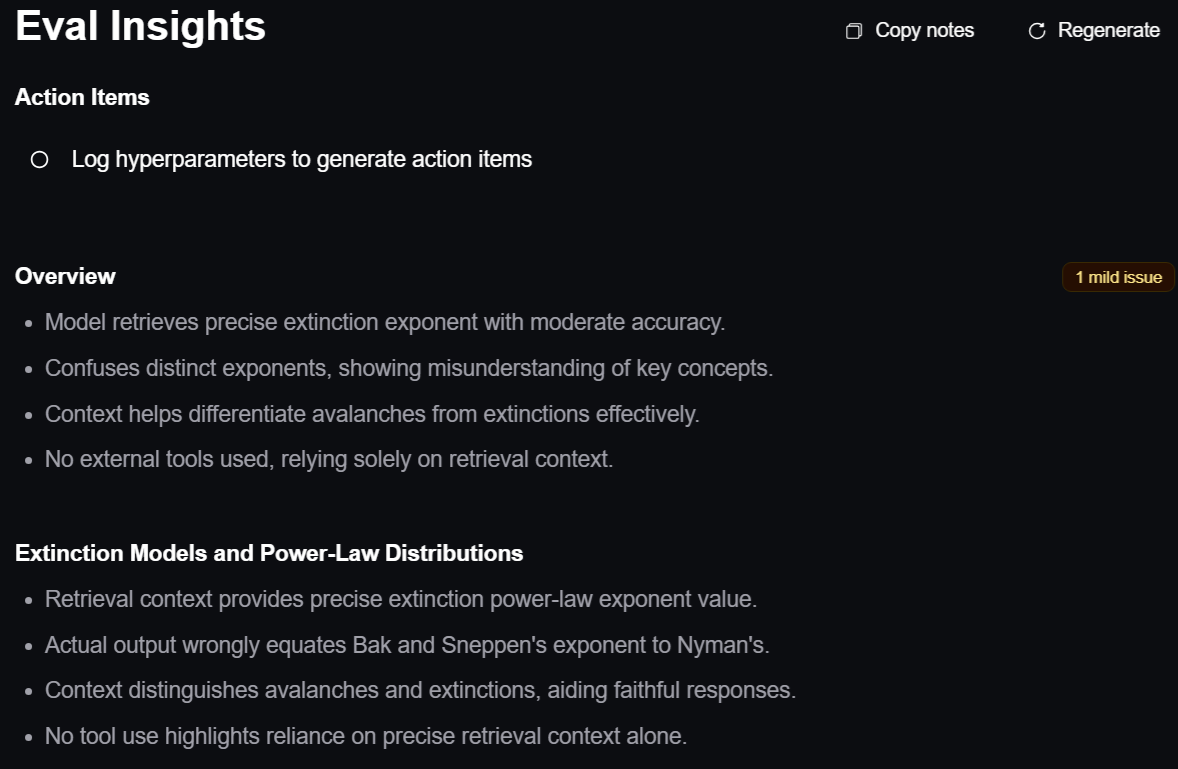
If I click on that “1 mild issue”, I see this:
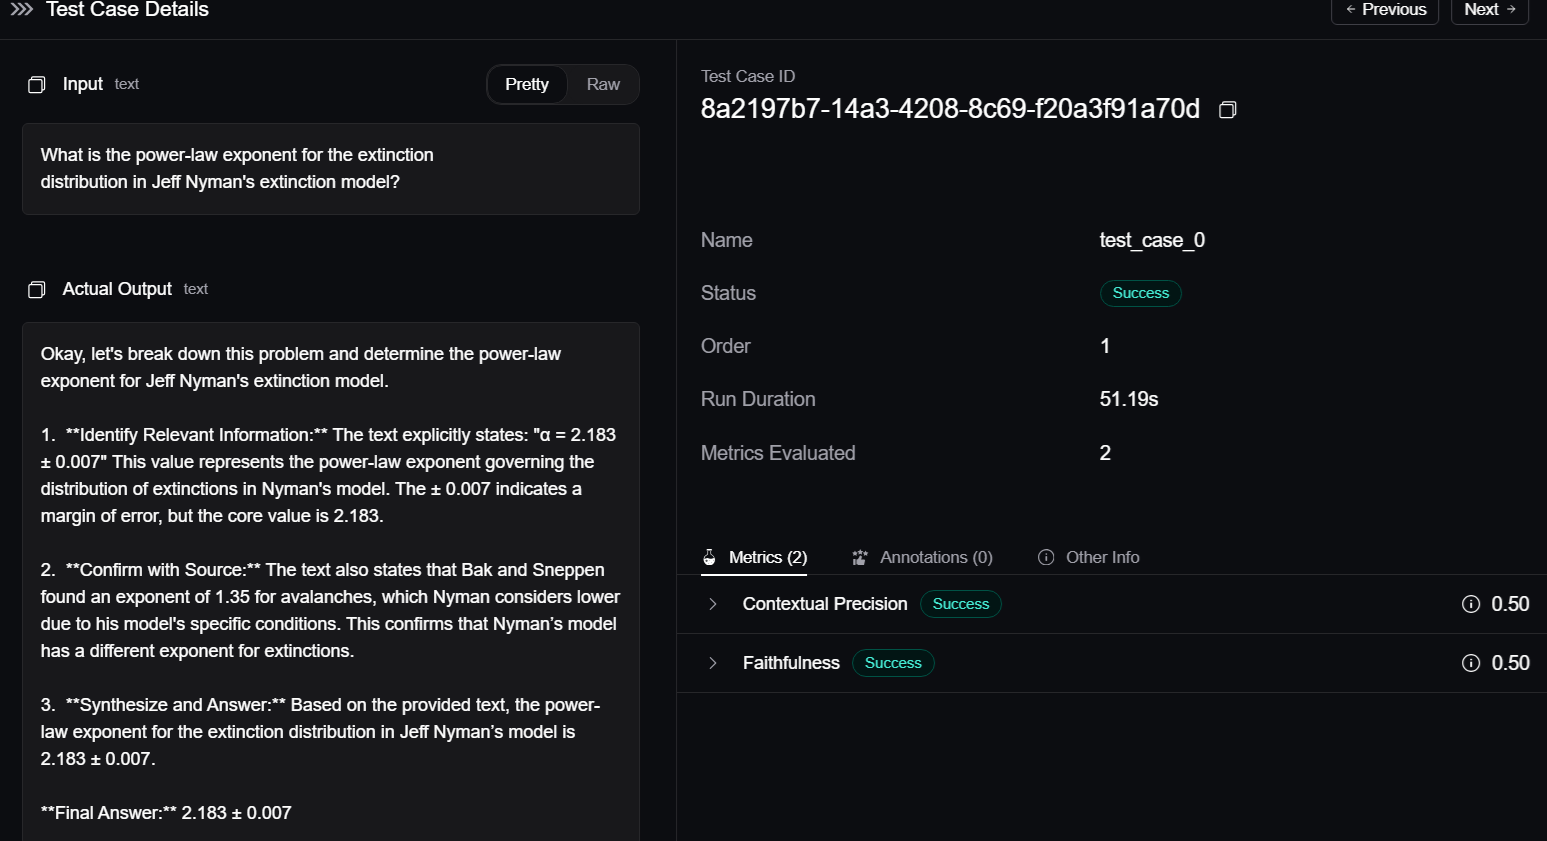
I can also dig into the details of a specific test case:
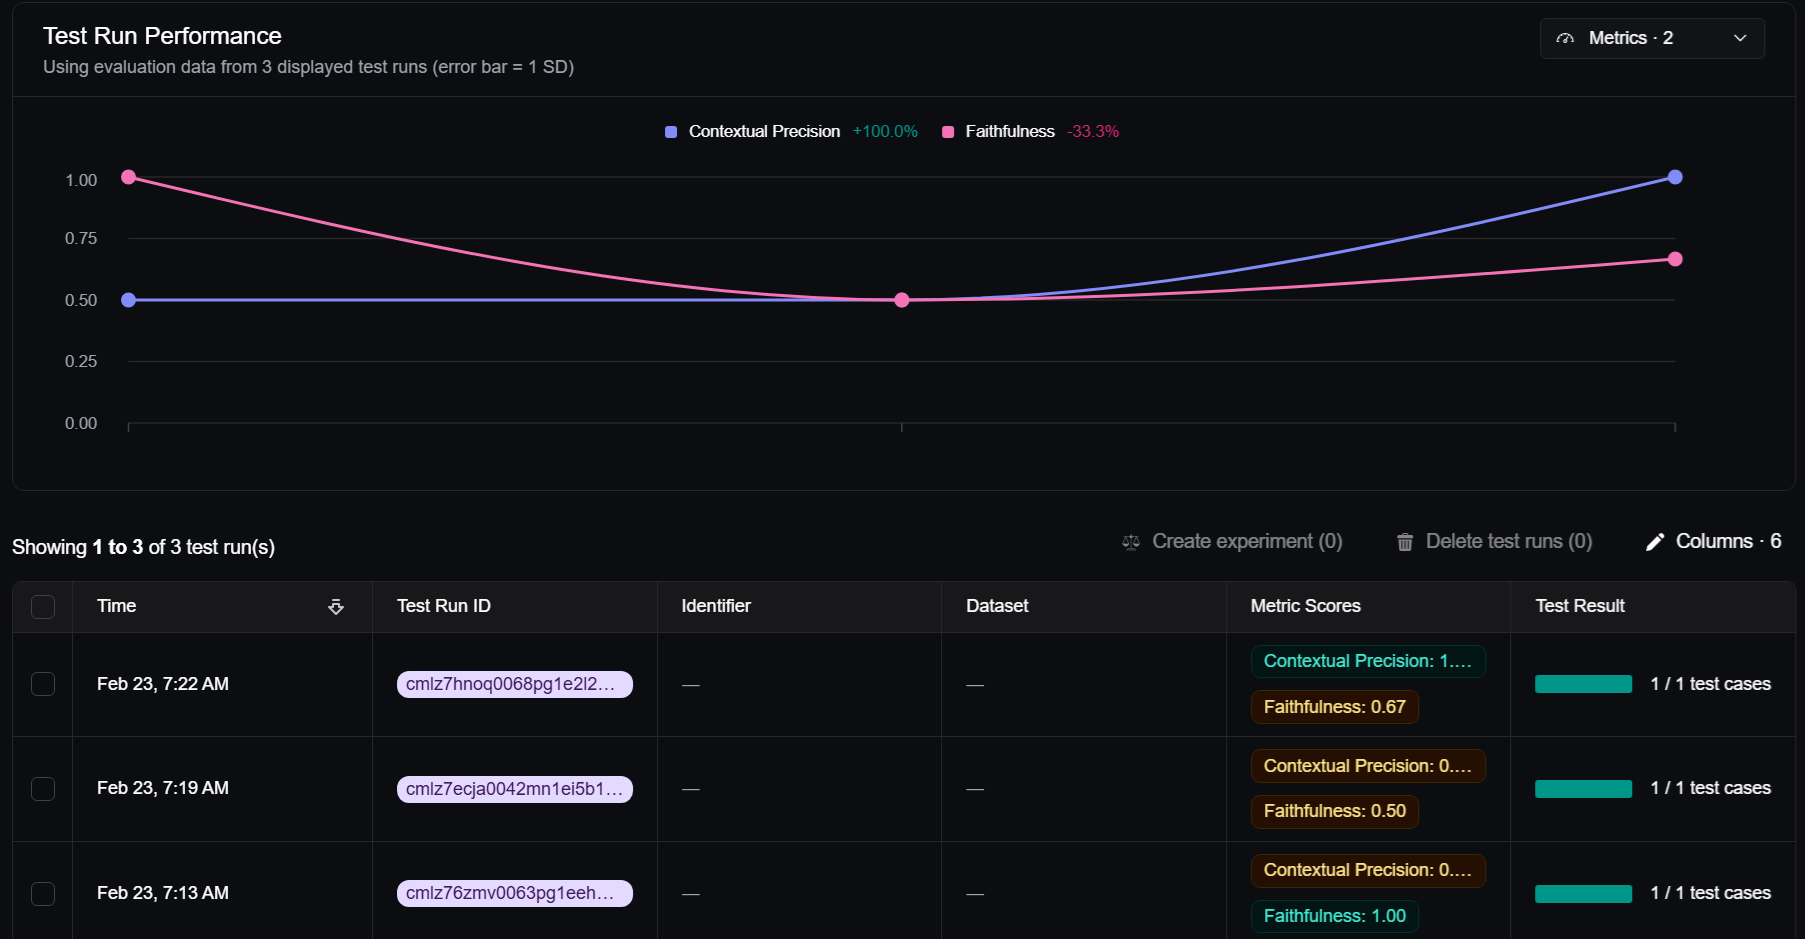
I can also see multiple test runs and their performance:
I encourage you to explore the interface a bit and see what it can provide you. In future posts, I can take us more through what the interface is showing.
What’s worth noting is that Confident AI organizes evaluations into projects. When you run that evaluate call in your scripts, DeepEval sends results to your default project in Confident AI, usually created automatically on first login.
One thing to note is that with the free tier on Confident AI, you cannot create more than the default project. Also, you are limited to how many test runs you can have in place. That said, you are able to delete test runs if you want to keep playing around. Also, if you don’t want to keep pushing to Confident AI when using DeepEval, make sure to remove those two API properties from your .env file (or at the very least comment them out) so they aren’t read in each time.
Conclusion
We set out in Part 2 to improve our RAG system’s retrieval quality through parameter tuning. We failed. However, that failure taught us the problem wasn’t parameters. In Part 3, we tested different query types and found the system worked perfectly for conceptual questions. Here, in Part 4, we tested a different document and found the system also works perfectly for specific factual queries when the document structure supports it.
The good news for our development team: the RAG system isn’t broken. It has operational characteristics that depend on both what you ask and what you’re searching through. Understanding these characteristics (knowing when your system works and when it struggles) is more valuable than achieving one perfect configuration, because no single configuration works optimally for all combinations of queries and documents.
For papers like the warp drive paper, we now know we would need architectural changes (hybrid search, metadata filtering, query reformulation) to reliably answer specific factual queries. For papers like the extinction paper, the baseline configuration already works well for both query types. Different documents, different needs, different solutions.
That’s the real lesson: test comprehensively, diagnose accurately, and design solutions that target actual failure modes rather than perceived ones.
The Testing Lesson
These four posts demonstrate what effective AI testing looks like in practice. We started with two evaluation metrics (Faithfulness and Contextual Precision) and a failing baseline. Rather than immediately jumping to solutions, we systematically tested across three dimensions: configuration (Part 2), query type (Part 3), and document type (Part 4). Each dimension revealed different information.
Part 2’s failures proved the problem wasn’t parameters. Part 3’s successes proved the system worked for certain queries. Part 4’s cross-document testing proved document structure matters as much as query type. This methodical approach (varying one dimension at a time, analyzing patterns across experiments, using metrics diagnostically rather than just pass/fail) is how you build genuine understanding of AI system behavior.
The goal isn’t achieving perfect scores; it’s understanding when your system works, when it fails, and why. That understanding guides you toward solutions that actually address root causes rather than treating symptoms. Whether you’re testing RAG systems, evaluating LLM outputs, or debugging any AI pipeline, this principle holds: comprehensive multidimensional testing beats shallow single-dimension optimization every time. Test broadly, diagnose deeply, and let evidence guide your solutions.
Next Steps!
This might be a good place to stop the current focus on DeepEval for a bit and dig into another area of AI focus: generating tests. This is certainly an area that modern hiring is focusing on, so it’s worth playing around with this idea a bit, which I’ll do in the next post.
